Archive
Tag "amsterdam"

Performative mapping can be a powerful way to engage with ‘the other’. The workshop MAPPING INVISIBILITY ‘visualised’ undocumented citizens’ experience of and hiding strategies in the public spaces of Amsterdam. As part of the thematic program Out of State*, Naomi Bueno de Mesquita (TRADERS researcher at Design Academy Eindhoven) presented MAPPING INVISIBILITY on January 20th 2015. It aimed to open the debate about the current policy regarding the presence of people without the right papers, and that of a steadily growing shadow society (the scenography of sheltering and looking away).

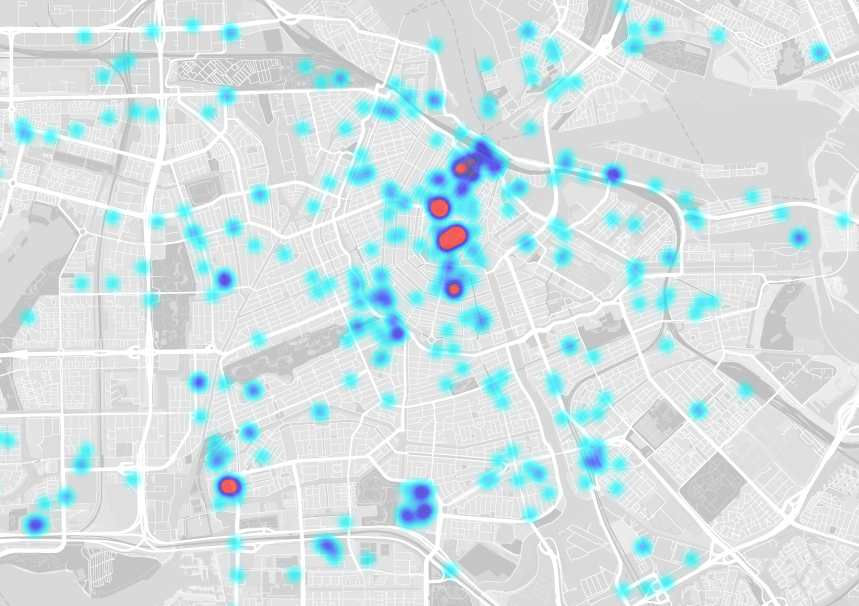
In the workshop (which took place a week prior to the presentation) a number of illegal immigrants (experts in living invisibly in the city) guided participants to places in the city with an emotion in mind (a total of four emotions were mapped). Prior to the fieldwork a legend was generated by the participants, consisting of emotions that they thought undocumented citizens experience in the city. While walking/ mapping the participant could evaluate preconceived ideas (to what extent the chosen words matched reality or not) in the dialogue with the undocumented. Changing from one emotion to another happened at a fixed time and for all cartographers simultaneously, until all the words of the legend were mapped. The guests rediscovered the diverse meaning and associations of public places and were introduces to strategies of hiding, such as avoiding to walk with a bag, pretending to be waiting for a train, etc.

Read More

The Digital Methods Summer School (June 23rd until July 4th 2014) was hosted by the University of Amsterdam. Naomi Bueno de Mesquita, TRADERS researcher in multiple performative mapping at Design Academy Eindhoven participated in this summer school. Digital Methods Initiative seeks to learn from the methods built into the devices online, by subtracting the data (links, tags, threads, etc) and repurposing them for social and cultural research. In this summer school with the topic ‘on geolocation’ the focal point was to analyse events as they unfold, by subtracting geo-located embedded data.


The first project explored how twitter data constructs a narrative of the city of Amsterdam, by analyzing the way people (locals and tourists) tweet about the city. Two data sets (geo-tagged data of Amsterdam and keywords about Amsterdam) of one month were used. Some of the findings: the most frequently used words to describe Amsterdam in Chinese were: creative, incredible and confused. A sudden peek of the word #zwerfie (a selfie taken while picking up trash) emerged in a neighborhood in the west, during the three day strike of garbage services in the city. As for the transportation, some individuals always tweet on the same spot while others commuting. Bus 300 had the most active tweeter. In general the bus or tram stops are more frequently used for tweeting than in the trams or buses. The problems/ limitations of this project: a methodological gap between keyword and geolocation-data analyses and the need to obtain more qualitative data. http://www.slideshare.net/naomibueno/201407-summerschool-dmilivability-in-amsterdam

bus tweets, http://mngroen.nl/dmi/mobility/

heat map of bus tweets, http://mngroen.nl/dmi/mobility/

Read More